Check results in the Grade Centre
Please see Blackboard Help for grading Tests, or Blackboard help for navigating grading for a more general overview of the Blackboard Grade Centre.
How to clear a student’s attempt
There may be occasions where you wish to clear a student’s attempt.
- Enter the Grade Centre.
2. Find the cell in the Grade Centre where the student row and assignment/test column align.
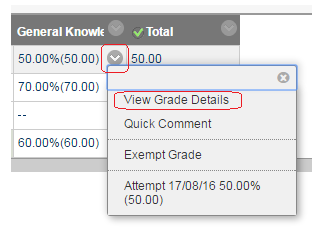
3. Hover your mouse over the cell and click on the action button.
4. Click on View Grade Details.
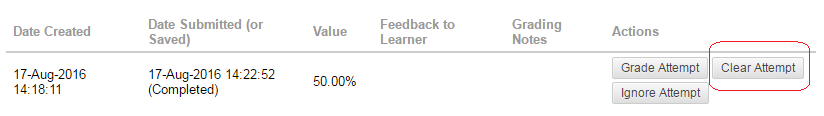
5. Details of the attempt are shown. Click on Clear Attempt.
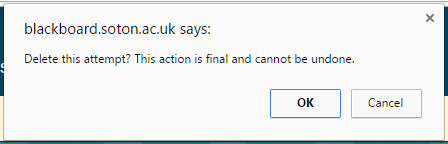
6. Confirm that you wish to clear the attempt.
Perform Item Analysis on Test questions
After students have taken a Blackboard test, you may use the Item Analysis tool to view statistics such as Discrimination, Difficulty, and Standard Deviation that may help you to identify questions that could be improved.
1. Access your course’s Control Panel and click on Course Tools to expand this part of the menu.
2. From the Course Tools menu choose Tests, Surveys and Pools.
3. Click on Tests.
4. Hover your mouse pointer over a test and click on the action button that appears beside it.
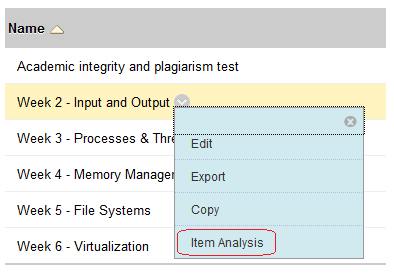
5. Choose Item Analysis from the menu.

6. Select the test from the drop down menu and click on Run.
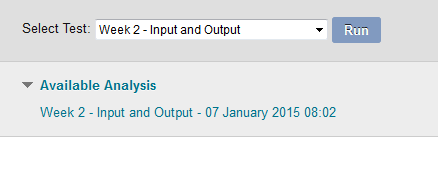
7. After a short wait you will be notified that the analysis has been produced and you may view it by clicking on the link under the Available Analysis heading.
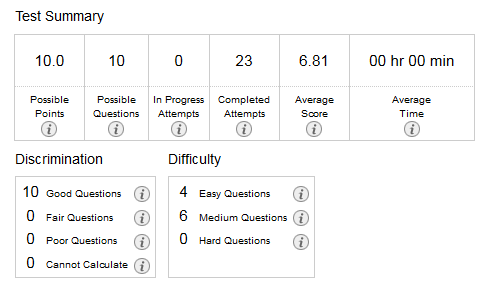
8. The first section provides a summary of how many questions there were, attempts made, and the average score.
9. Following this is a breakdown of the Discrimination and Difficulty of the questions. This is described in the Blackboard manual as follows:
Discrimination: This area shows the number of questions that fall into the Good (greater than 0.3), Fair (between 0.1 and 0.3), and Poor (less than 0.1) categories. A discrimination value is listed as Cannot Calculate when the question’s difficulty is 100% or when all students receive the same score on a question. Questions with discrimination values in the Good and Fair categories are better at differentiating between students with higher and lower levels of knowledge. Questions in the Poor category are recommended for review.
Difficulty: This area shows the number of questions that fall into the Easy (greater than 80%), Medium (between 30% and 80%) and Hard (less than 30%) categories. Difficulty is the percentage of students who answered the question correctly. Questions in the Easy or Hard categories are recommended for review and are indicated with a red circle.
10. Following this is a breakdown of this information on a per question basis.
Please also see Blackboard Help for Item Analysis.
Viewing an Attempt
5. From the Grade Details page click on Grade Attempt to view the student’s answers to the test. Note that if there are multiple attempts you may view them all by clicking on View Attempts.
Attempt Statistics
6. To view how all students answered a test, or to view survey results, click on the double arrow symbol at the top of the column next to the name of your test or survey and select Attempts Statistics.
Column Statistics and Results Download
Column Statistics
Item Detail will provide a list of statistical information including Variance and Standard Deviation.
Download Results
Results of tests and surveys may be downloaded and used for statistical analysis through applications such as Excel or SPSS.