
Exporting a detailed spreadsheet of your exam results
Results Export
You should only use this feature the day after your exam has taken place.
- Log into OnDemand
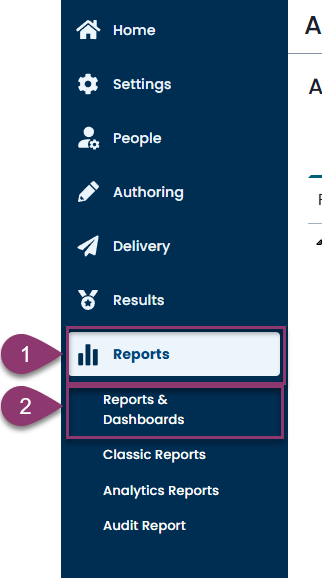
- From the menu along the top choose “Reports” and then “Reports and Dashboards”.
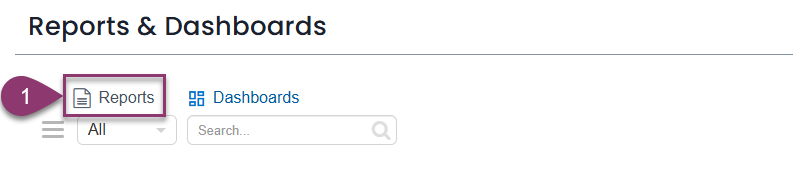
- Then select Reports
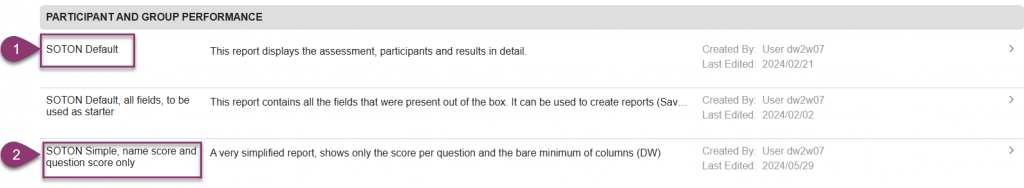
- You can now choose which report to run. We have created two templates. SOTON Default will give you a detailed report and SOTON Simple has less details for an easier to read report.
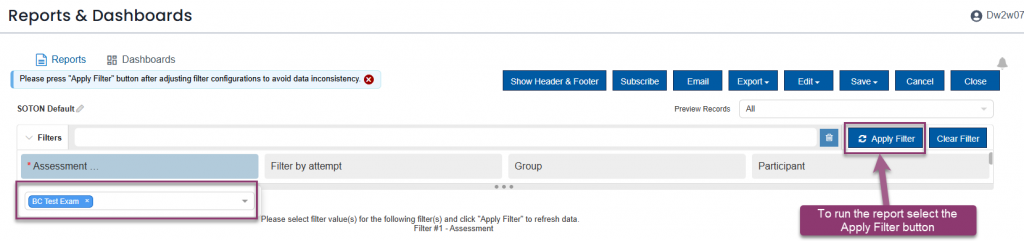
- After you have chosen which report to run you will need to specify the exam you wish to report on.
- Select the Assesment filter, remove the “null” place holder and start typing the module code for your exam and the list will start to filter based on your typing. When you see the exam you need select it. It will become highlighted in blue as shown.
- To run the report select the Apply Filter button.
- The report will now be generated. This can take a while. Three dancing dots will indicate that something is happening
![A screenshot of the "Reports & Dashboards" page. The top section shows tabs for "Reports" and "Dashboards" and several action buttons like "Show Header & Footer", "Subscribe", "Email", "Export", "Edit", "Save", "Cancel", and "Close". Below this, there's a "Filters" section with input fields for "Assessment", "Filter by attempt", "Group", and "Participant", along with "Apply Filter" and "Clear Filter" buttons. At the bottom, under the heading "[+] Results Export Report with Item Details", there is a description that reads "This report displays the assessment, participants, and results in detail." Below this text, a small, purple rectangular box contains three blue "dancing dots" or ellipses, indicating that the system is processing or loading.](https://elearn.soton.ac.uk/wp-content/uploads/sites/436/2019/03/image-4-1024x279.png)
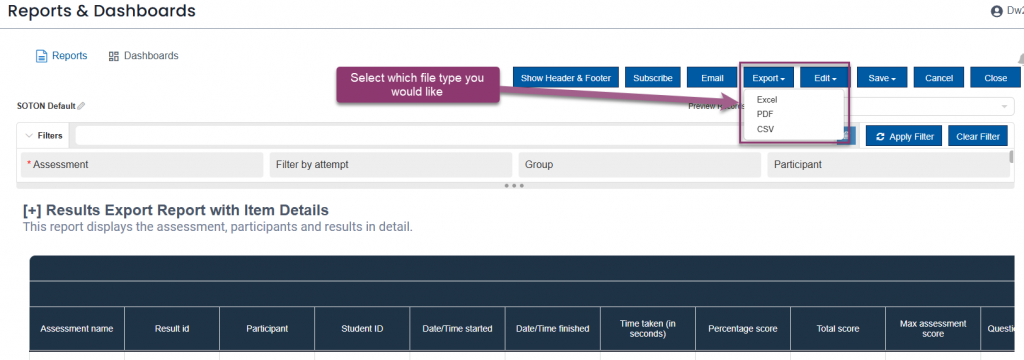
- When the report is ready a preview is displayed.
- To export the report select the Export button and choose Excel or CSV. After a short wait your file will start to download.
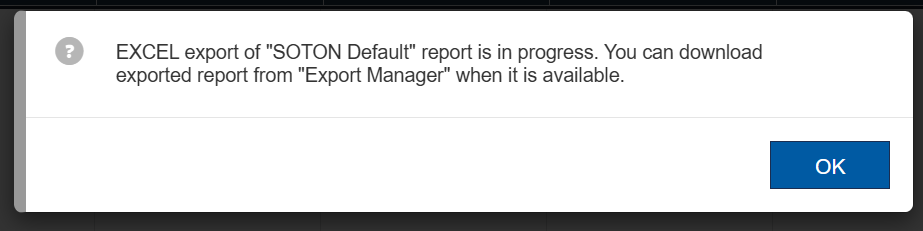
The report will be generated and a red dot will appear by the bell icon when it is ready. This can take up to 30 minutes. Longer if your report is large or demand for reports is high.
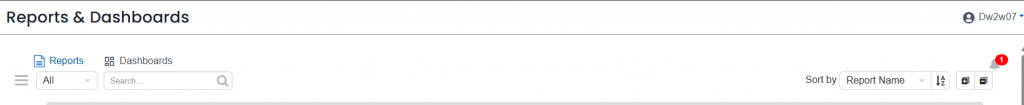
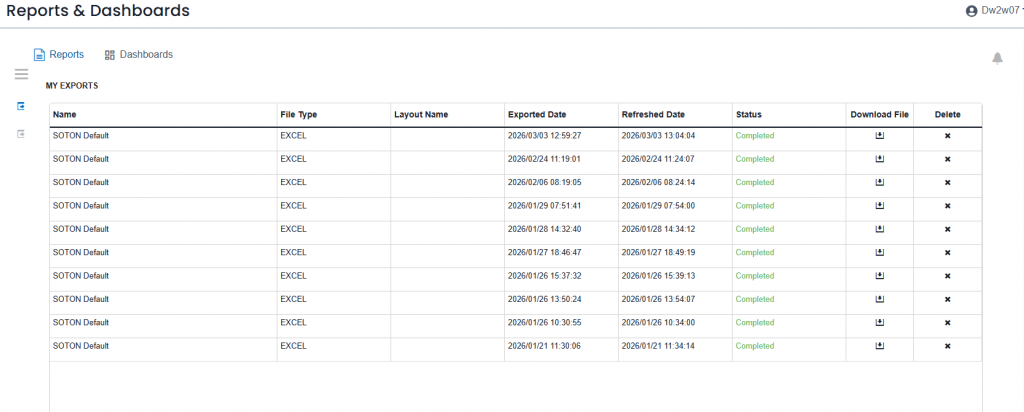
Click the bell icon when the red indicator appears. There will be a notification for you to select. When you do you will be taken to a list where you can download your report.
Problematic Questions
You may have had a problematic question during the exam. Follow this link for a guide that shows you how to exclude a question.
See a results report for an individual
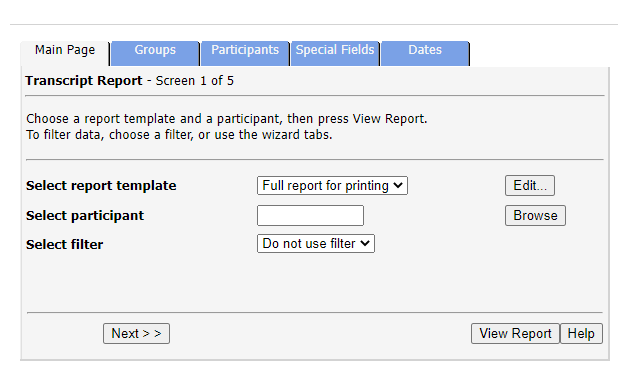
Transcript report
Use this to see the results of an individual
- Log into OnDemand
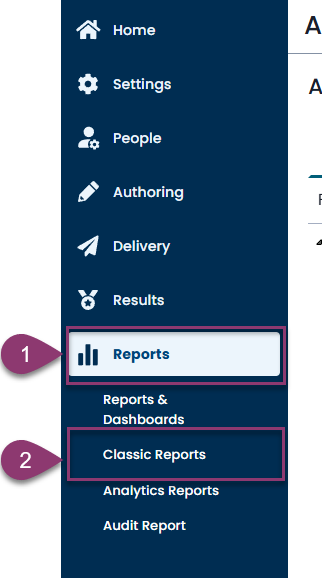
- From the menu along the top of the screen choose “Reports” then “Classic Reports”.

- Then select “Transcript Report”.
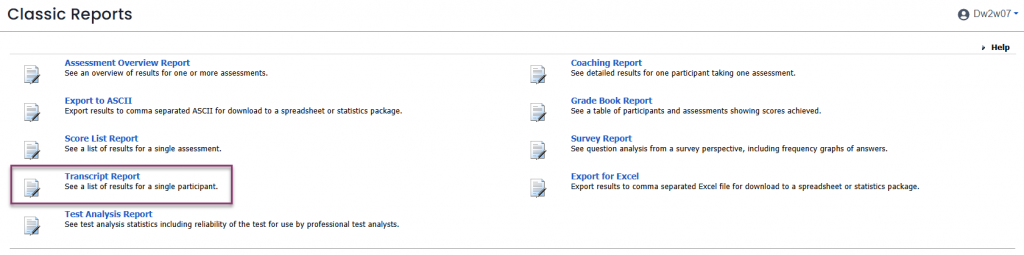
- In the “Select Participant” field type the name of the student you are looking for and press the “View Report” button
- You will see their score and will be able to click on the “Coaching Report” button to see their answers to each question
- If “in progress” is shown, then this indicates that the student has not yet pressed the “Submit” button on their exam session
See an overview of how a cohort has scored (available sooner than above but less detailed)
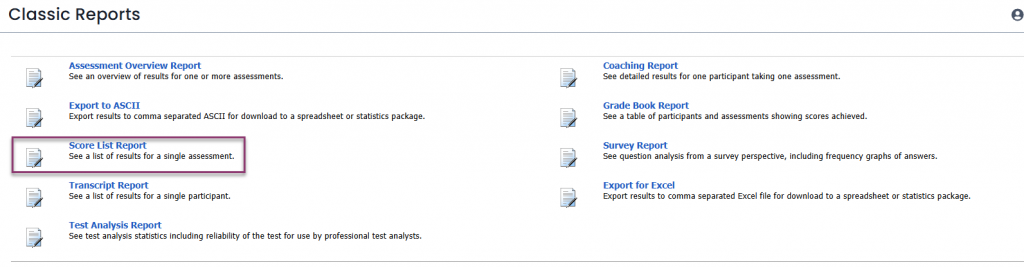
Score List Report
Use this for an overview of how the whole cohort has scored in an exam
- Log into OnDemand
- From the menu along the top of the screen choose “Reports” then “Classic Reports”.
- Then select “Score List Report”
- Don’t type anything and press the “browse” button
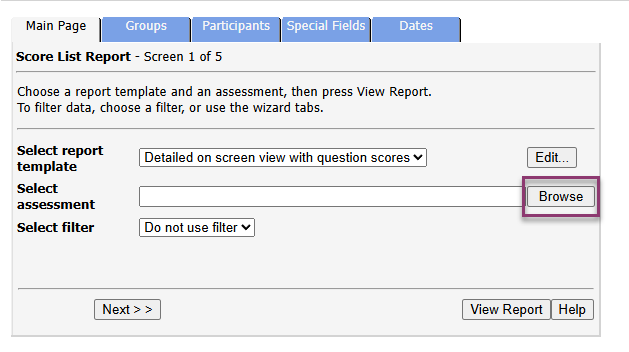
- Find your exam in the list and click on it to see the results
- If “in progress” is shown then this indicates that the student has not yet pressed the “Submit” button on their exam session